对于一个后端开发者,性能分析及其重要,在Go语言中, 提供了一些优秀的诊断工具来帮助我们深入分析应用程序的执行情况,这些工具中最常用的当属pprof。
提出问题
- Go性能分析要关注什么
- pprof 如何使用
- pprof分析报告解读
性能分析
- CPU:程序对CPU的使用,时间都花在哪里;
- Heap:堆内存分配及占用内存的情况,是否存在内存泄漏;
- goroutine:goroutine 运行堆栈信息
- Block:阻塞等待信息
- Mutex: 锁竞争情况
pprof 使用
开启 pprof
-
方法一,引入 “net/http/pprof”
import _ "net/http/pprof"这样我们就可以通过访问
http://localhost:6060/debug/pprof来访问pprof -
方法2,自定义端口及地址
func RunProf(port int) {
	mux := http.NewServeMux()
	mux.HandleFunc("/debug/pprof/", pprof.Index)
	mux.HandleFunc("/debug/pprof/cmdline", pprof.Cmdline)
	mux.HandleFunc("/debug/pprof/profile", pprof.Profile)
	mux.HandleFunc("/debug/pprof/symbol", pprof.Symbol)
	mux.HandleFunc("/debug/pprof/trace", pprof.Trace)
	if port != 0 {
		ip := "localhost"
		go func() {
			addr := fmt.Sprintf("%v:%v", ip, port)
			tlog.Infof("pprof httpserver server listening on: %v", addr)
			err := http.ListenAndServe(addr, mux)
			if err != nil {
				tlog.Fatal("pprof httpserver start failed. err: ", err.Error())
			}
		}()
	}
}

// 或者在 gin 集成
// RunProf 启动性能监控
func RunProf(r *gin.Engine) {
	// 将 pprof 与路由器实例关联
	r.GET("/debug/pprof/*name", gin.WrapH(http.DefaultServeMux))
}
获取pprof信息
-
直接访问网页 http://localhost:port/debug/pprof/,但这类信息是阅读不友好的,所以一般不使用。
-
执行
go tool pprof http://localhost:port/debug/pprof/XXX进入交互界面,输入help,里面有各种方式来查看数据,诸如 web,svg… -
生成的pprof分析文件,
go tool pprof -seconds=30 http://localhost:port/debug/pprof/profile > cpu.pprof,我们可以通过-seconds=xx来设置采样时间,生成文件后可以指定端口在网页查看,比交互界面更直观:go tool pprof -http=:port cup.pprof -
XXX 参数在 runtime/pprof/pprof.go 定义
"profile":      cpuProfile,
"goroutine":    goroutineProfile,
"threadcreate": threadcreateProfile,
"heap":         heapProfile,
"allocs":       allocsProfile,
"block":        blockProfile,
"mutex":        mutexProfile,
看懂性能分析
一般在生产项目中,我们会dump下分析文件,在本地进行分析
-
第一步:
go tool pprof -http=:8088 pprof分析文件 -
第二步:web 直接看图
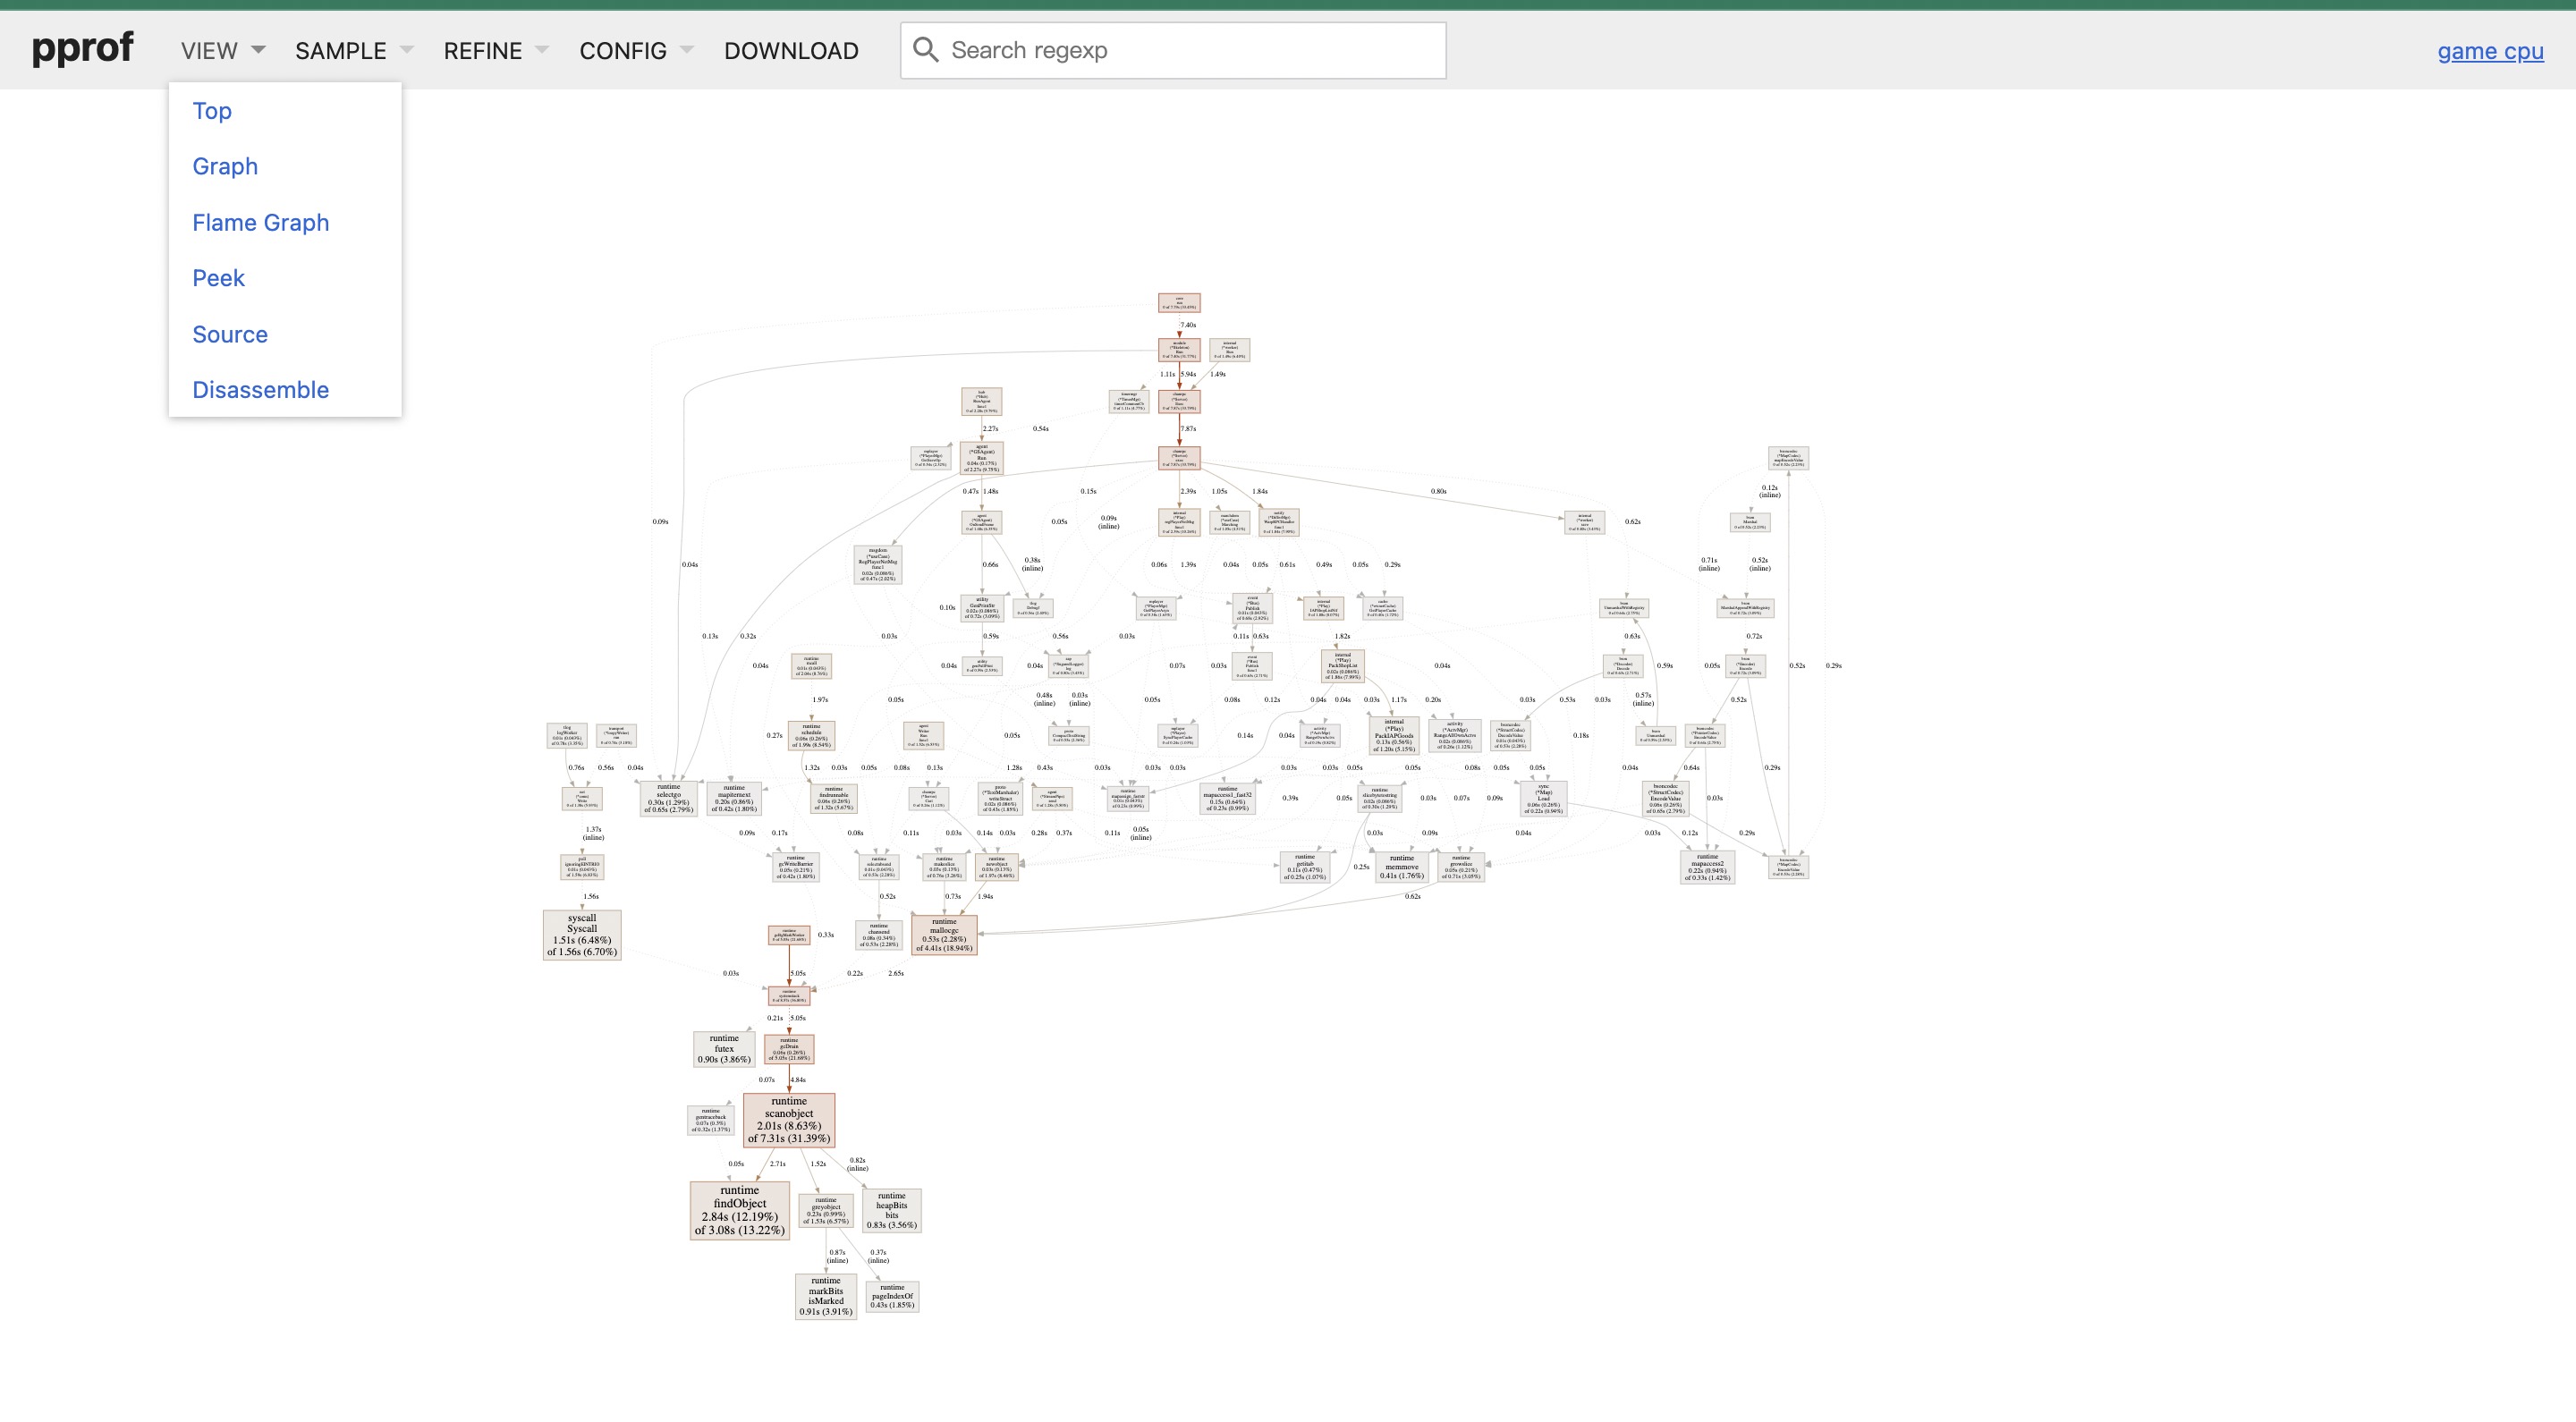
- 当前界面为Graph界面,这个图是采样30s内的CPU使用情况分析,矩形越大说明,线条越粗则证明占用越大
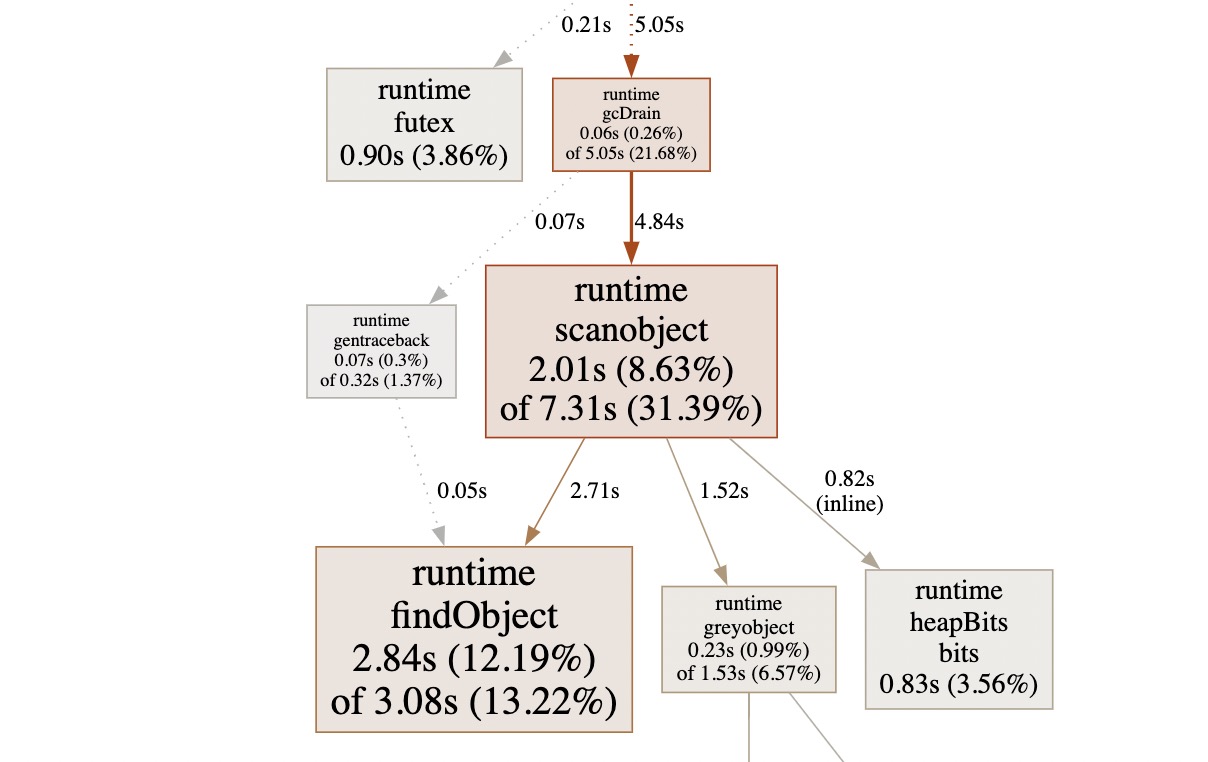
- 这里截取了最大的矩形,可以从具体的内容看到详细信息,如函数名:scanobject,占用2.01s,占总共7.32s的31.39%,然后还有细分的内容。这里结合go特性,可以得出一个问题:gc扫描占用了很大比重,说明程序中堆上的对象分配过多
-
另外的常用方式,火焰图 flame graph,top
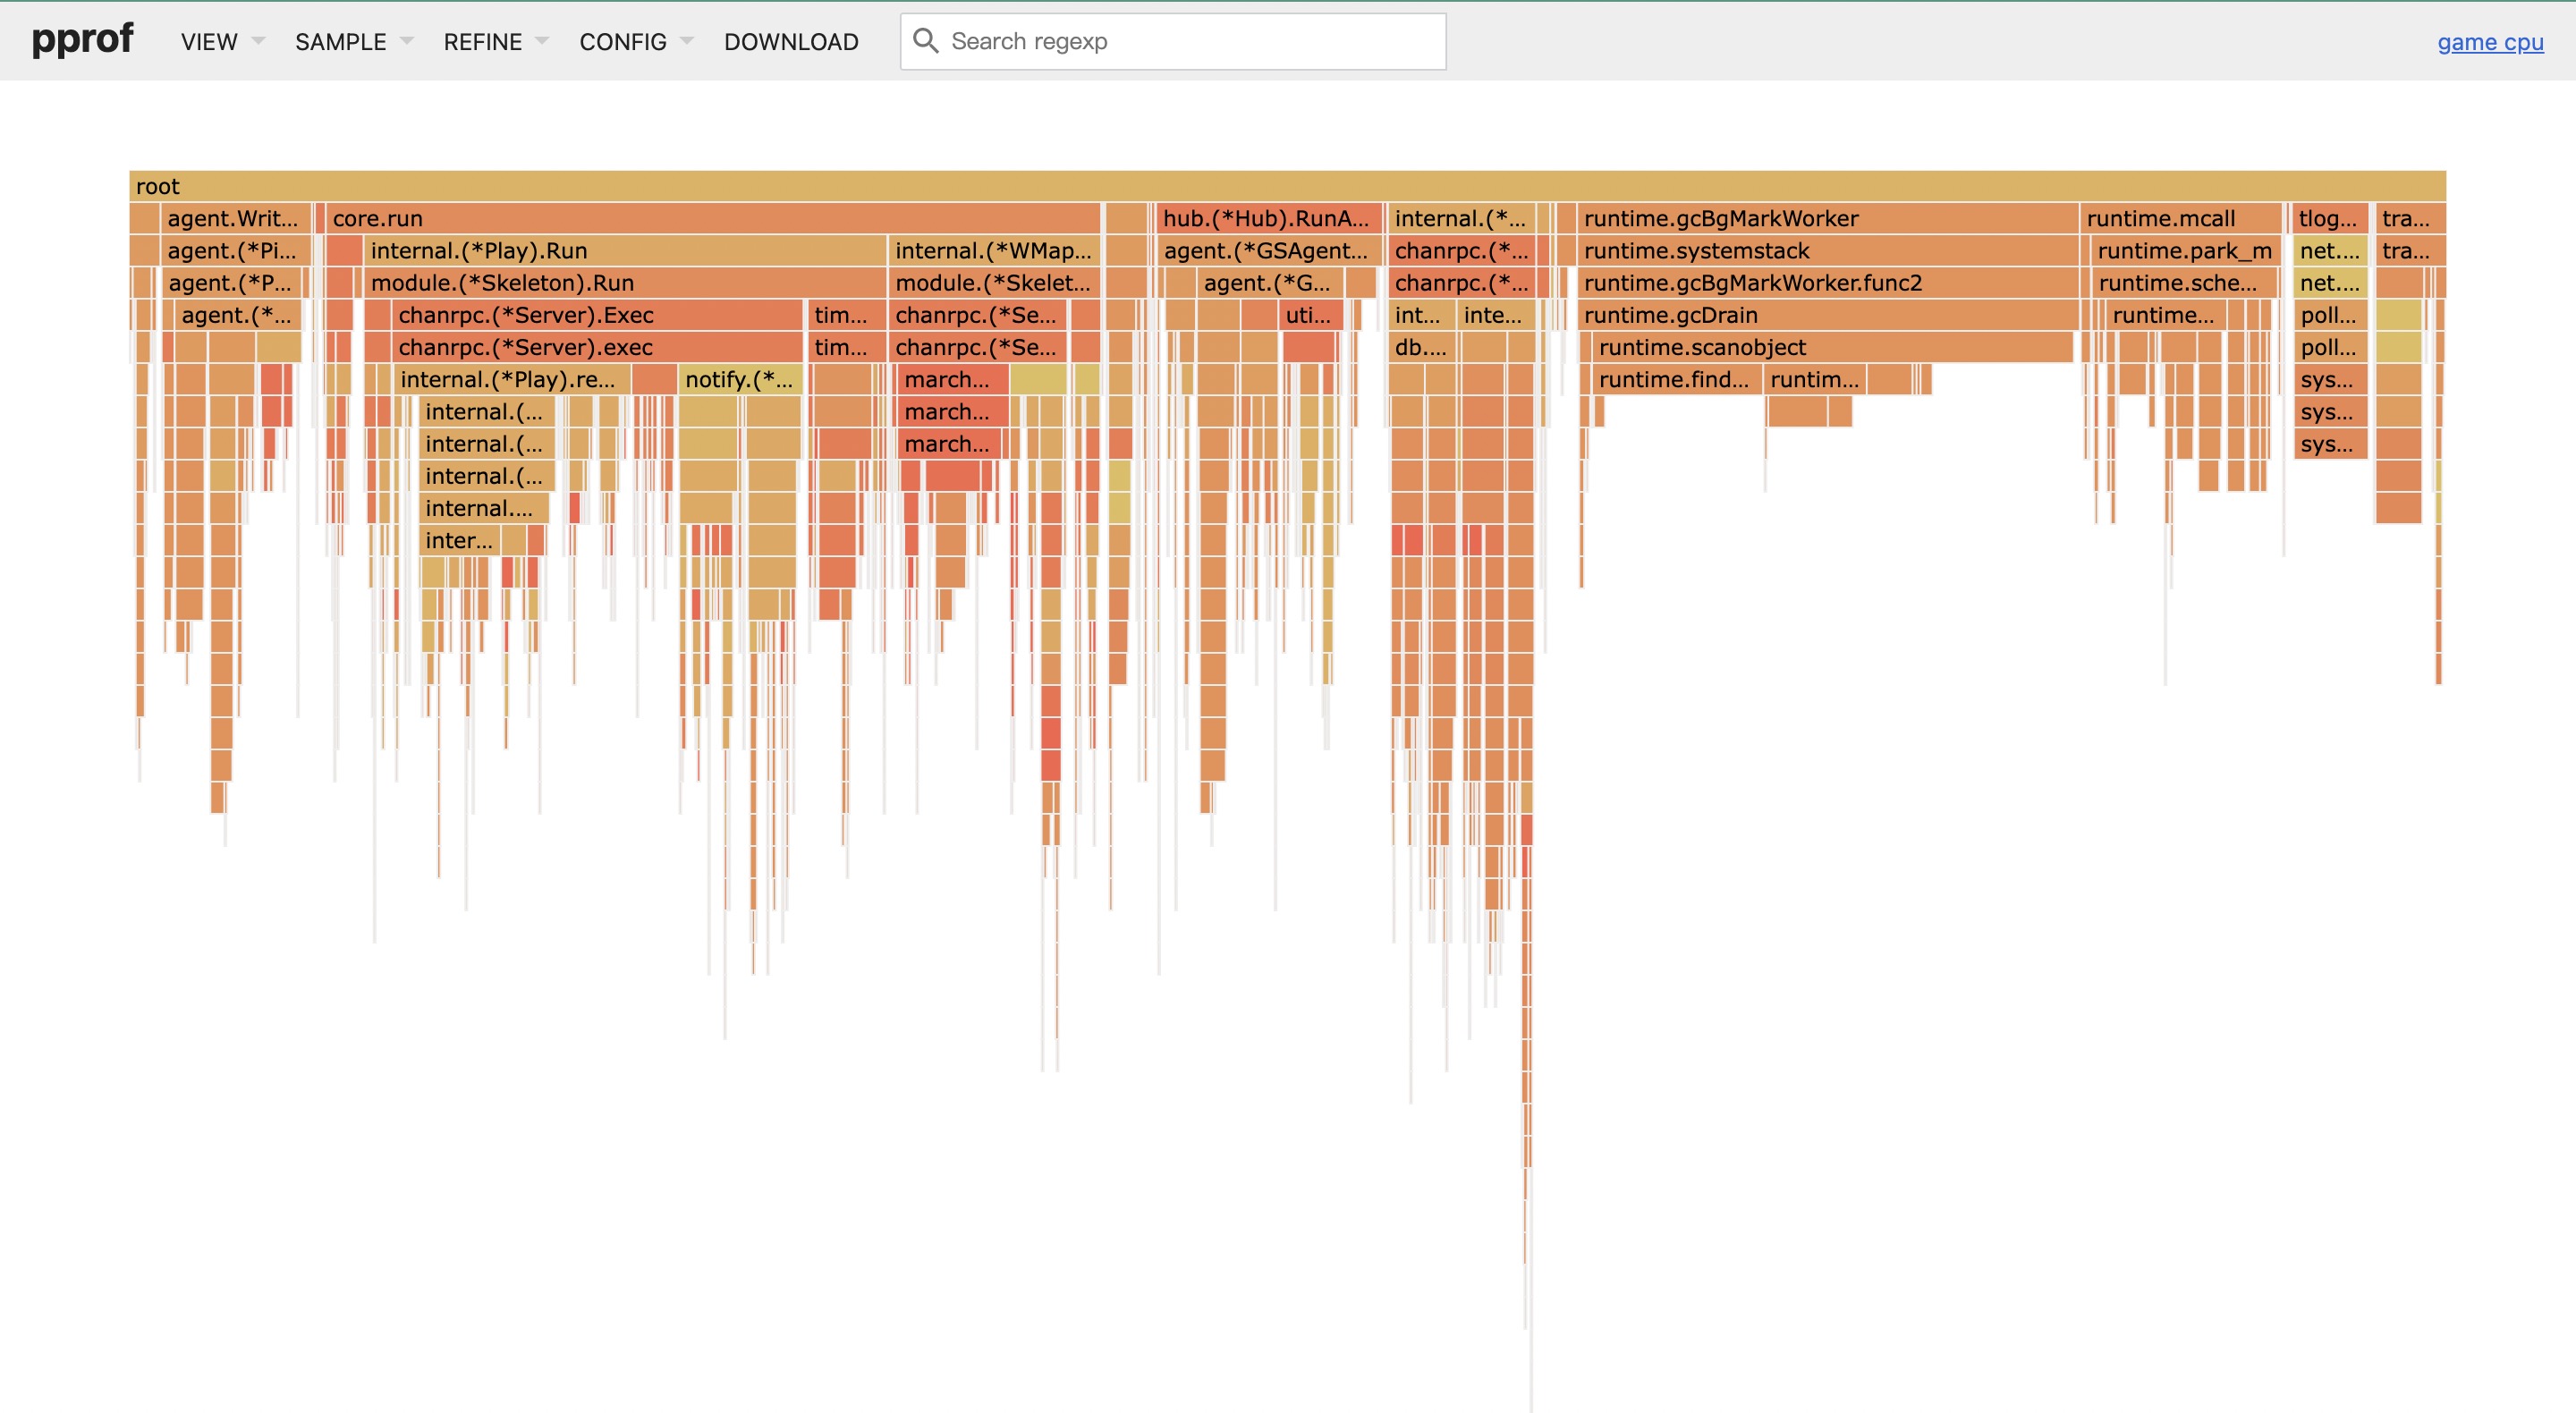
- 火焰图可以更直观的看出函数的调用栈,同时越宽代表占用越多,此处可以得出同上结论
- top 则是列出文字分析信息
- 如果是直接的交互分析,还还可以通过
list func来查看热点函数具体的代码
-
在得出了堆上分配对象过多,于是进行了heap采样分析,同理,我们定位到具体的函数,对函数进行逃逸分析,最后对这部分代码进行了优化,减少了对象分配,从而减少了gc占用时间。
总结
- 这里只是简单的描述了pprof的使用,然后结合了一次生产环境的分析经历,记录下如何做pprof性能分析。
- 作为后端程序,一定要时刻关注性能,了解性能热点,及时对代码进行分析重构。
- go 提供了镰刀,我们就要学会当死神。